

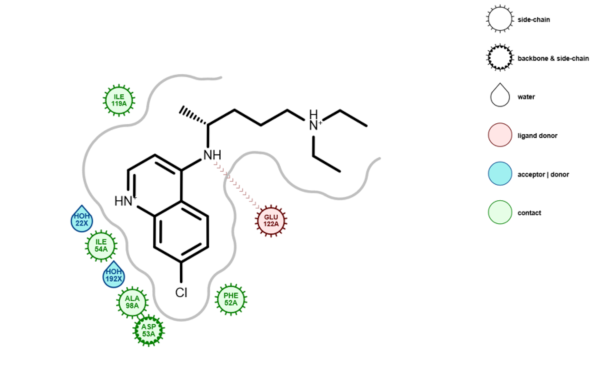
How can we more quickly and efficiently extract the rich complexity of information and knowledge embodied in the three-dimensional structure of a protein-ligand complex? In the February 2015 toolkit release OpenEye extends the ability to represent complex, three-dimensional protein-ligand structures in two dimensions with the deployment of Ligand Depiction in Proteins, LDiP 1.0. This will save medicinal chemists and protein biophysicists countless hours staring at lists of complexes in 3D molecule viewers, instead enabling them to focus quickly on key compounds, key interactions or key properties. Example output from LDiP is shown in Figure 1. The emphasis is on clarity and immediacy of representation, without sacrifice of important information.

Figure 1: Depiction of the 1CET complex in LDiP
One of the key advantages of LDiP is that the ligand depictions retain, as far as possible, the information in the input 3D conformation. Another notable capability in LDiP is the automatic depiction of water molecules near the ligand, which could be involved in important interactions with the protein, the ligand or both.
A clear advantage of providing this solution as part of a toolkit, rather than an application, is the flexibility to expand the nature of the input information. As a simple example it is possible to include in the depiction of an X-ray structure of a protein-ligand complex the electron density; in this way the user can see at a glance when a ligand structure is clearly defined by experimental electron density and when parts of a ligand structure are not defined by electron density (see Figure 2). This is an example of how information-rich yet problem-relevant depictions can easily be made by using LDiP in concert with other parts of our toolkit offering. The code to depict electron density on a ligand is already available in our Python cookbook.
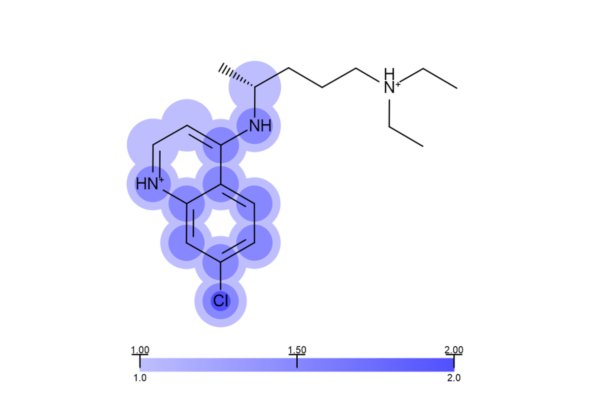
Figure 2: Depiction of the ligand from the 1CET complex, with each atom coloured according to the level of electron density in its immediate environment (darker colours indicate more density in around that atom).
Given the importance to communication and decision making of reducing, as faithfully as possible, complex three-dimensional information to straightforward two dimensional representations this problem has been under investigation at OpenEye for some time. Our first offering in this area was the ROCS Report tool to simplify and accelerate the analysis and communication of results from ROCS searches. ROCS Report takes as input three-dimensional molecular overlays from ROCS and represents them in two dimensions in a manner that is both clear yet faithful to the original three-dimensional information. Similarly we provide a tool to analyse the scores from predicted poses from docking in our OEDocking tool. The LDiP tool therefore represents the next step in the evolution of 3D-driven depiction in 2D at OpenEye.
This entire project has been driven by the lead developer on our molecule depiction code, Krisztina Boda. We look forward to seeing what she will come up with next.