VISUALIZATION OF MOLECULAR INTERACTIONS & PROPERTIES
Grapheme™ TK
2D structure depiction of molecules is the "natural language" of chemists, since this representation instantly conveys many important molecular properties.
Historically, 2D representations have mainly been used to visualize the connection table of molecular graphs. However, projecting 3D information into the 2D layout and displaying various atom and bond properties on the molecular diagram opens up a novel way to present information to chemists.
Grapheme TK provides several representation schemes that allow visualization of complex molecular interactions and properties in a clear and coherent 2D format that is the most natural to chemists.
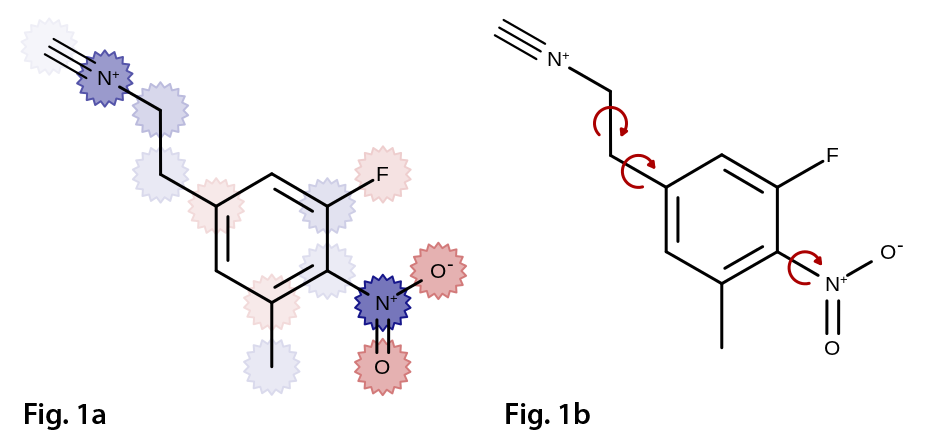
Molecule annotations: (a) visualizing atom partial charges (b) annotating rotatable bonds.
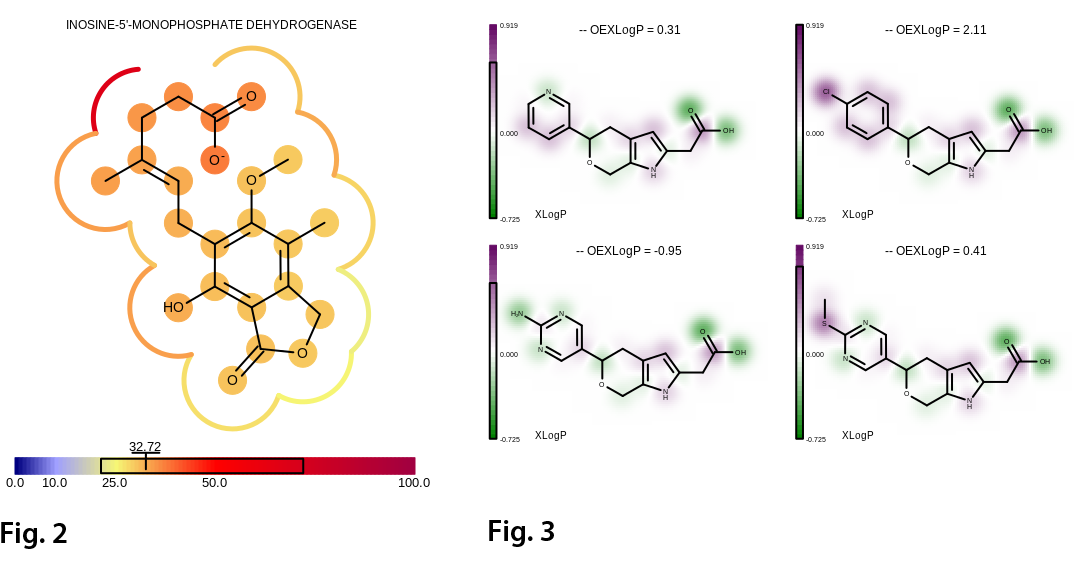
Fig. 2 Visualizing the B-factor of the ligand (MOA) using atom annotations and projecting the average B-factor of the adjacent receptor atoms into the 2D molecule surface (complex 1meh). Fig. 3 Projecting the contribution of each atom of the total OEXLogP into a 2D property map.
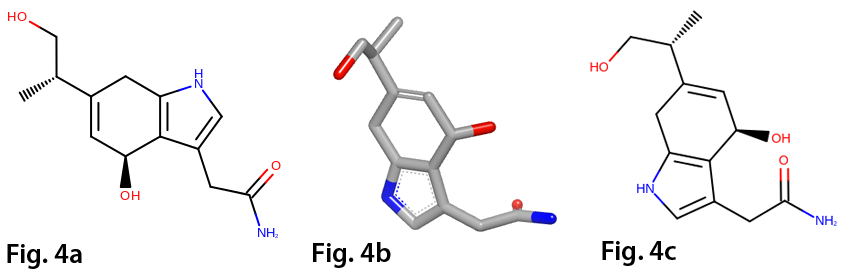
Generation of 2D depictions (a) default 2D layout, (b) 3D conformation, (c) 2D layout driven by 3D conformation.
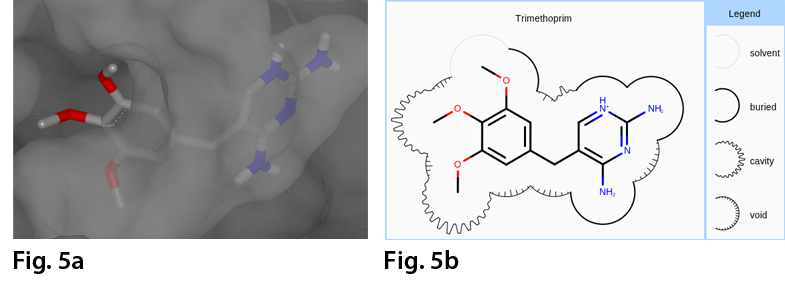
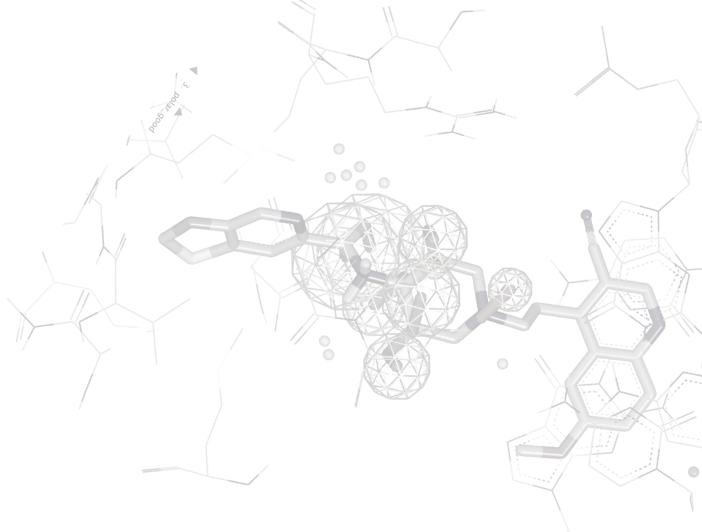
Example of the 2w3a complex (a) in VIDA (b) the 2D depiction of the complex where the molecule surface is annotated based on the distance between the accessible surfaces of the ligand and the surrounding protein.
For more detailed information on Grapheme TK, check out the link below:
Documentation